The Insights tab turns a client's synced ledger into analysis you can use for advisory work. Every figure is computed from the ledger, budgets and the assumptions you state. AI only drafts report wording, which an accountant reviews before the client sees anything.
Insights need the client's ledger: a QuickBooks Online or Xero connection, or imported files (a general ledger or trial balance, and bank statements). Without either, Insights says so and links to the Accounting tab. Open the client and go to Insights.
Track KPIs on the overview
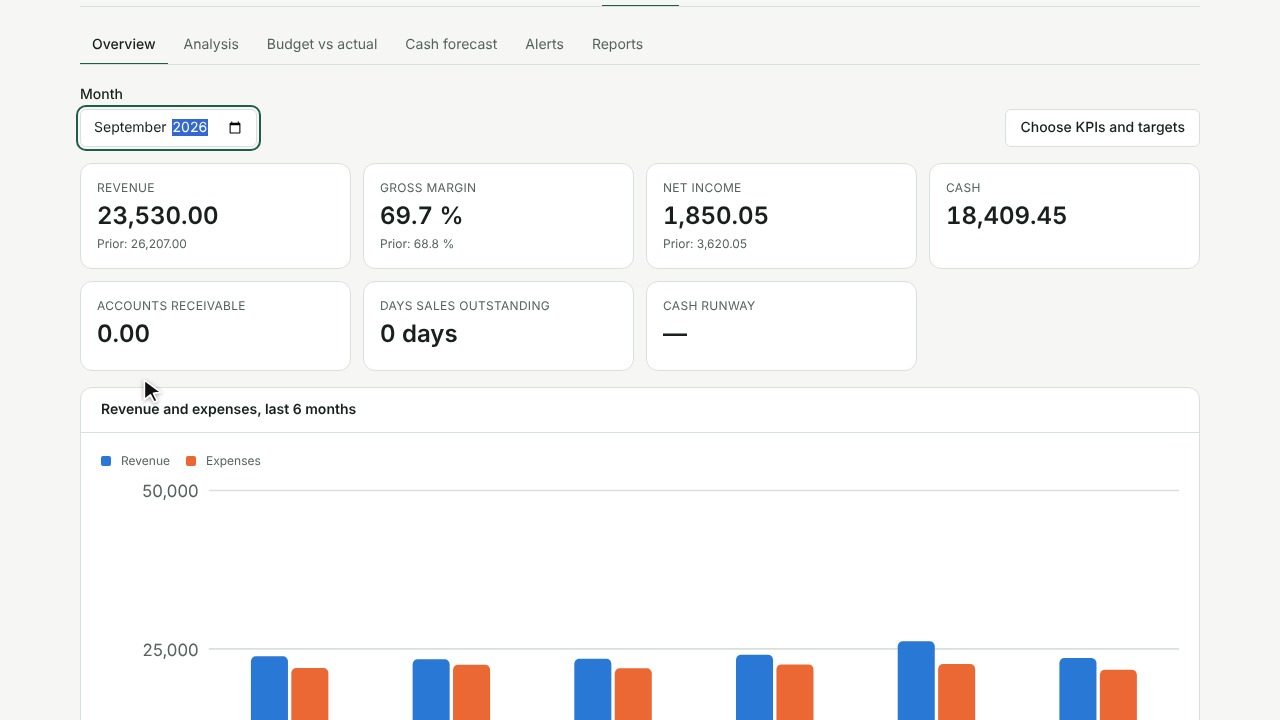
Overview shows the client's key figures for a Month, such as revenue, gross margin, net income, cash, receivables, payables and cash runway, each with the prior value. A chart shows revenue and expenses for the last 6 months.
- Select Choose KPIs and targets.
- Pick the KPIs to show and set a Target min or Target max.
Each KPI then shows On target, Below target or Above target. Hover a KPI to see how it is calculated.
Analyse the P&L
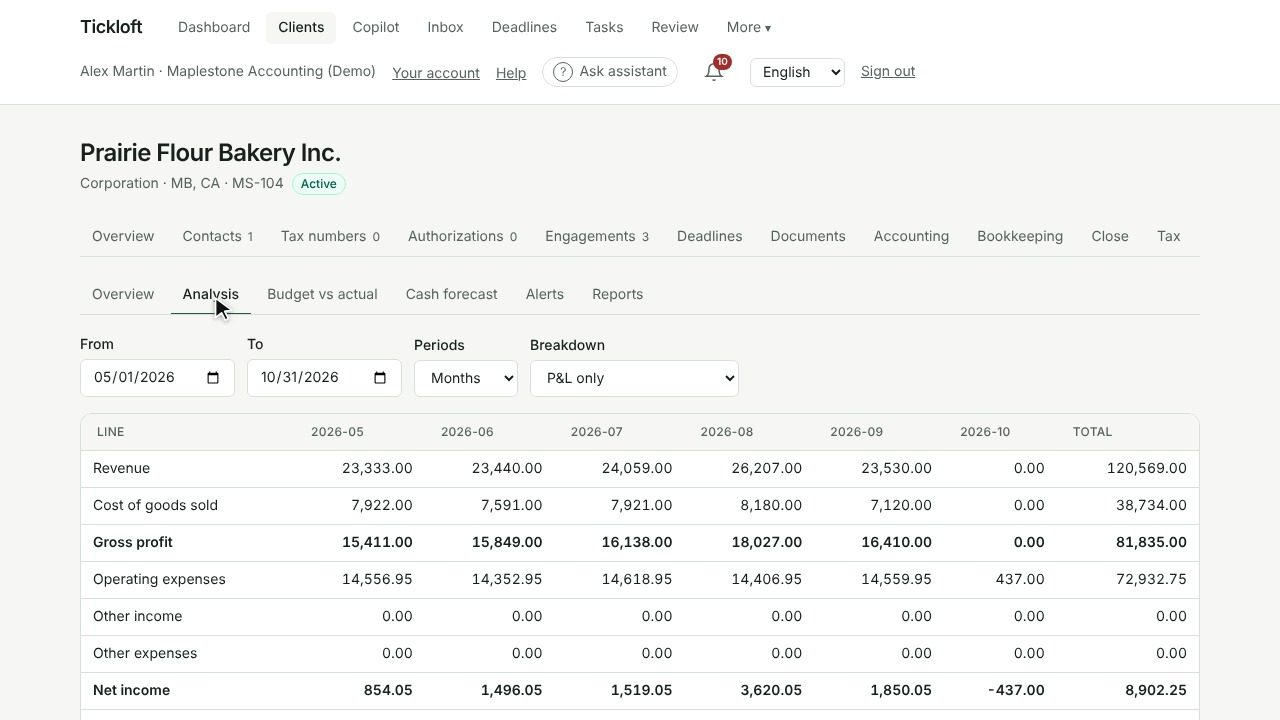
In Analysis, choose a date range (From and To), Periods (Months or Quarters) and a Breakdown: P&L only, By account or By customer and vendor. Figures come from coded bank lines, invoices, bills and journal entries.
Build a budget and compare with actuals
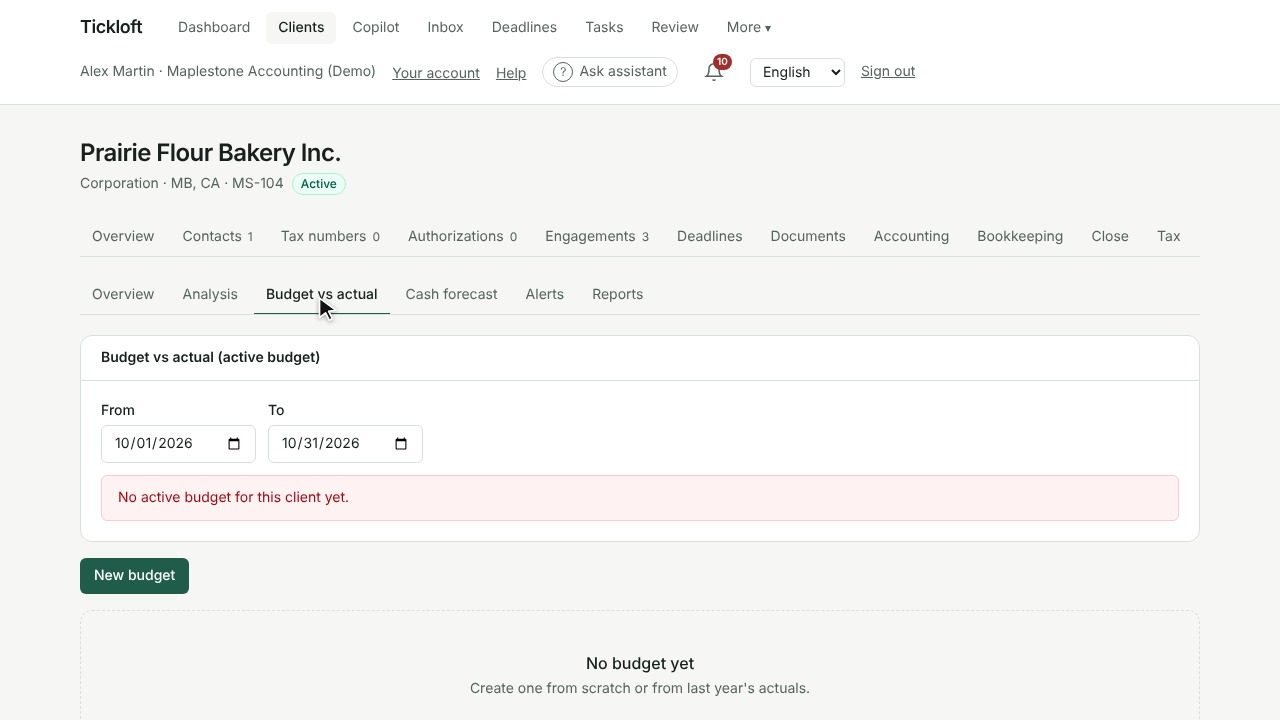
- In Budget vs actual, select New budget.
- Enter a Name and Fiscal year start, and choose Start from: Empty, or Prior-year actuals with a Change (%).
- Edit amounts by account and month, or use Import CSV (an Account column and one column per month in YYYY-MM format). Select Save changes.
- Select Make active. A client has one active budget at a time.
The comparison shows Actual, Budget and Variance by account, with a Why column that explains material variances using the top customers or vendors, the number of entries and the same period last year. Positive variances are favourable.
Forecast cash and test scenarios
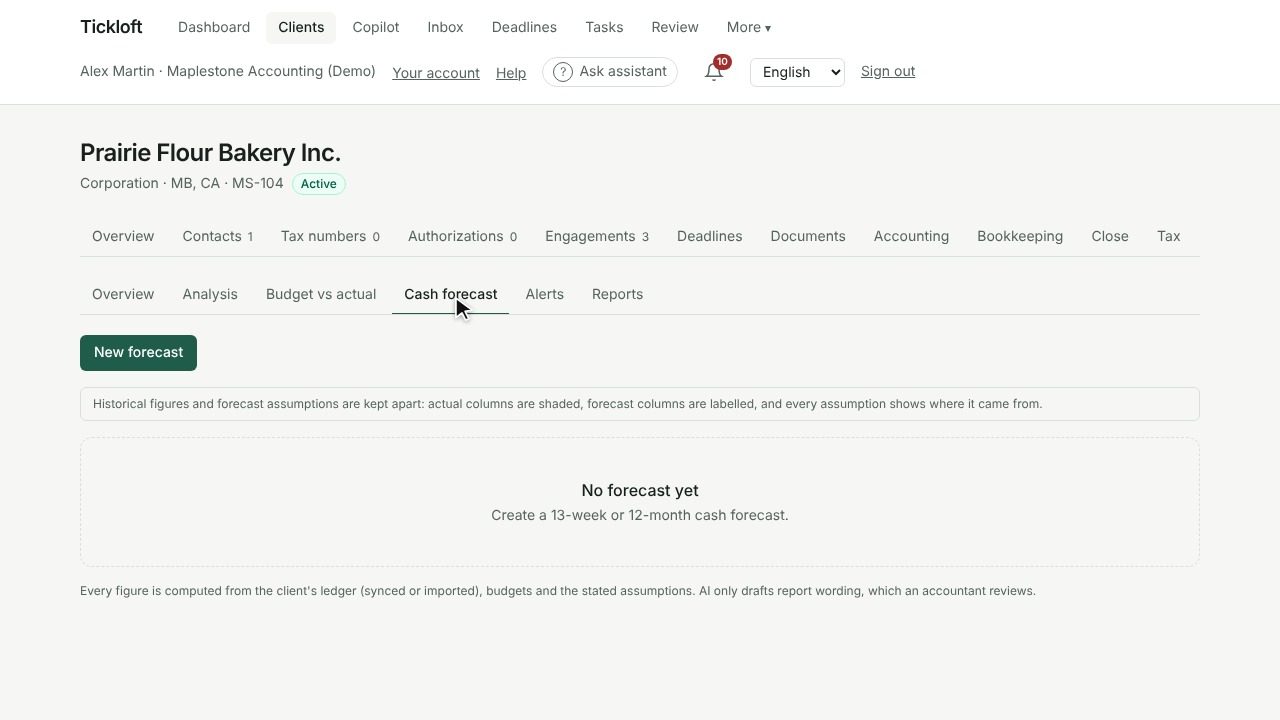
- In Cash forecast, select New forecast, enter a Name and choose a Horizon: 13 weeks or 12 months.
- Review the Assumptions: opening cash, weekly receipts and payments, collection delay, payment delay, minimum cash and more. Each shows its Source: Computed, Edited or Default.
- Edit a value to override it, or select Reset to go back. Add one-off items and new hires as needed.
- Select Refresh computed values after a new sync.
Actual columns are shaded and forecast columns are labelled, so history and projections never mix.
To test a what-if, select Add scenario, give it a Name and enter the Changes, such as slower collections, a price change or a hire. Use Compare with to chart a scenario against the base case, including its lowest point and ending cash.
Review spending alerts
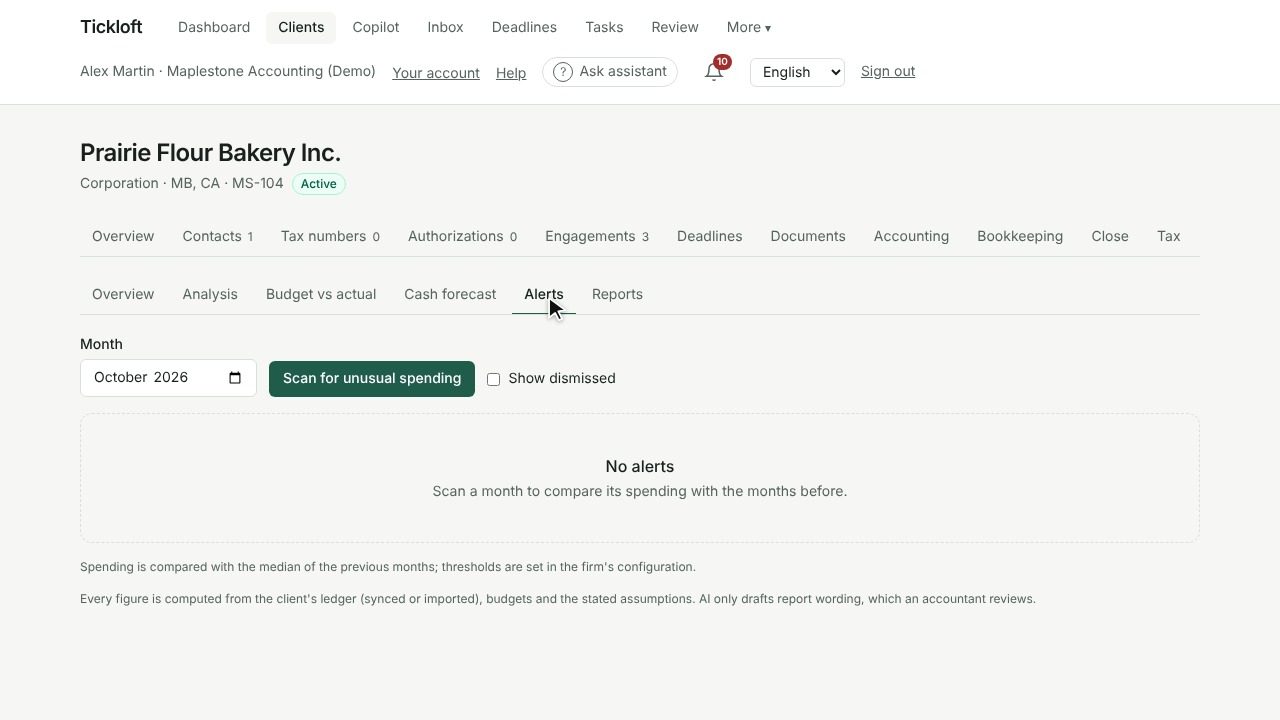
In Alerts, choose a Month and select Scan for unusual spending. Tickloft compares spending with previous months and flags vendor or account spikes, new vendors and large transactions. Select Dismiss with a Note once checked, or Show dismissed to see them again.
Draft and share a report
- In Reports, choose a Report type (Management report or Advisory recommendations) and a Month.
- Select Draft report.
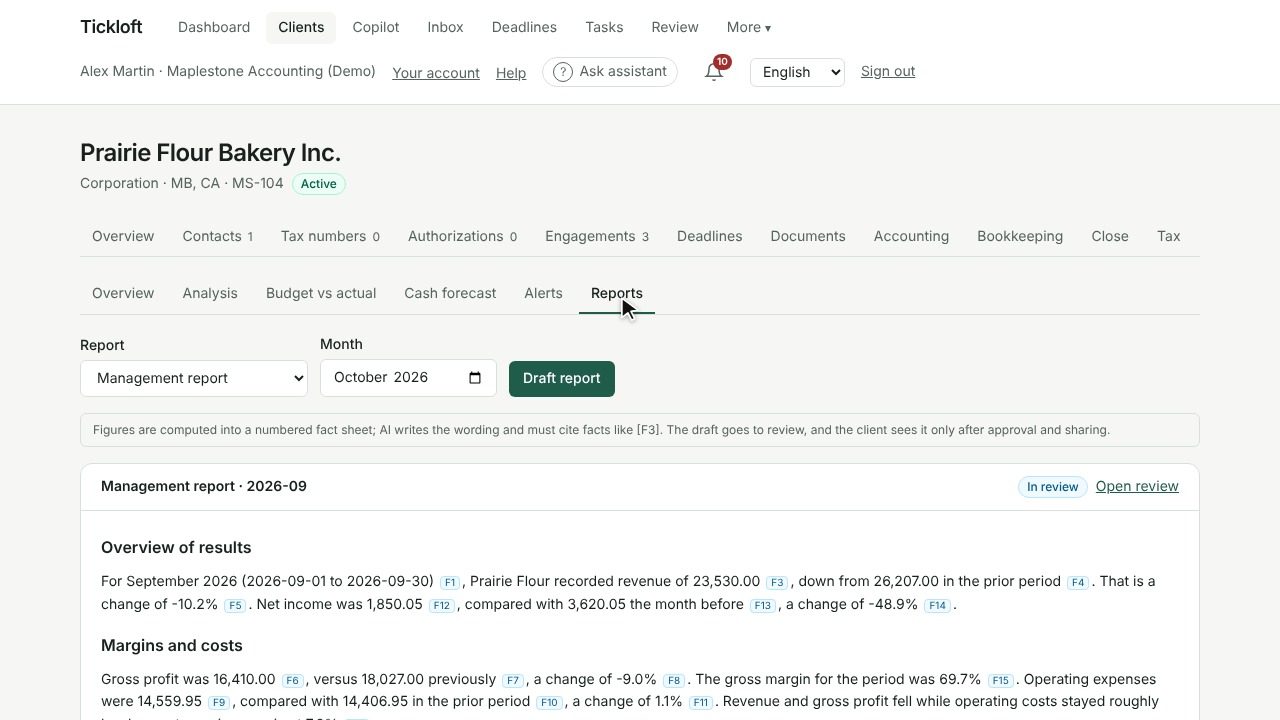
Tickloft computes a numbered fact sheet, and AI writes the wording, citing facts such as [F3]. Select Show fact sheet to check the figures. Flags such as Numbers not on the fact sheet or Recommendation without a cited fact tell you what to check.
- Select Open review and approve, edit or reject the draft in Review.
- Once it's Approved, an owner, admin or reviewer selects Share in client portal.
The client sees the report only after it is approved and shared. Select Stop sharing to remove it from the portal.
Tip: Reports are never sent automatically. Sharing is always a deliberate step.